Tracking Urban Rails-to-trails Discourse on Reddit
Background
Urban greenways present an exciting yet contentious movement within cities. Their advantages are evident: repurposing neglected spaces into versatile public assets, enhancing neighborhood connectivity, fostering economic growth, and advocating for healthier urban environments (Keith, 2021). Still, local stakeholders highlight contributions to gentrification in nearby areas, alongside worries about increased crime rates and vandalism as well as property tax implications with rising housing values (Institute for Housing Studies, 2020). The involvement of local residents in the planning and implementation process remains a pivotal, yet often overlooked, aspect of this initiative's success, underscoring the need for inclusive planning and community engagement (Palardy, 2018).
Social media has proven to be a community asset in sourcing public opinions on urban infrastructure (Gao, 2022). Reddit stands as a potential hub for diverse perspectives on the discourse surrounding urban greenways. This platform, characterized by a forum based structure and community-driven subreddits, offers a space where individuals actively engage in discussions. As users contribute to various conversations, sentiment can be examined through post titles and comments.
Using a social media platform like Reddit can contribute towards a data-driven approach for urban planners and policymakers. Social media platforms offer a unique opportunity to analyze trends, patterns and sentiments expressed in discussions on urban greenways that are difficult to capture through traditional surveys and public meetings. This method holds the potential to bring unique insights to the forefront while simultaneously contributing towards the democratization of the planning process for urban infrastructure. The potential of social media in shaping urban landscapes reflects a shift towards more participatory and inclusive urban governance.
Research Motivation
In this research we wanted to investigate what discourse happens around urban rails-to-trails on Reddit, a social media platform. We wanted to know can a social media platform such as Reddit be a source of opinions in the discussion around urban greenways?
We approached the exploration through three concerns:
- Investigating user characteristics: we were interested in identifying where users post the most, what are the characteristics of these users and are there any discernible patterns about user activity and their discourse on rails to trails.
- Tracing temporal sentiment trends: We also wanted to explore how the online sentiment about rails-to-trails evolved over time, how that has impacted the online conversations and are there any regional patterns or place-based patterns.
- Identifying common themes and concerns: Finally we wanted to find common themes and concerns that users share on Reddit subcommunities about rail-to-trails, and how these concerns have evolved. Understanding recurring themes and concerns allows for a more nuanced view of what matters to the community, which can guide more effective and responsive planning decisions.
Scope of the study
This study selected four cities—New York, Chicago, Atlanta, and Detroit—to examine the urban phenomenon of transforming former rail lines into expansive, versatile urban greenways. While converted urban greenways exist in both urban and rural settings, our focus centered on the urban context. New York and Chicago feature completed linear greenways, widely discussed in urban planning circles. In contrast, Detroit and Atlanta feature partially completed yet fully operational greenways. Both completed and ongoing trails serve as focal points for discussions, with researchers delving into the effects of established greenways.

Data Collection
Scope of collection
The dataset was collected through a combination of city specific subreddits and searching for greenways in urban planning related subreddits. Using Python’s PRAW library, we first collected the posts in the 22 selected subreddits based on the 8 specified tags. We then collected all the comments on the threads to build a comprehensive dataset. We wanted to get both the posts as well the comments so that our dataset reflects the actual discourse on Reddit
We tracked the following subreddits:
["Atlanta","Chicago","Detroit","NYC","urbanism","chibike","fuckcars","urbanplanning","urbanism",
"parks","nycbike","bikedetroit","micromobilitynyc","bicycling","bicycletouring","bikecommuting",
"urbandesign","urbanstudies","urban","left_urbanism","strongtowns","YIMBY"]
The following search tags were used:
                    ["beltline","highline","606", "bloomingdale trail","Joe Louis Greenway",
                    "dequindre cut","greenway", "greenways"]
The tags are based on the names of the prominent rails-to-trails in the 4 cities within the scope of our study, and also general greenway discourse within the selected subred
Data at a glance
Our final dataset after cleaning and processing included:
- 1,574 unique threads
- 37,795 comments
- 14,109 users
- 22 subreddits
- Earliest entry: 2009-12
- Latest entry: 2023-11
View a subset of the data
Where is the conversation happening?
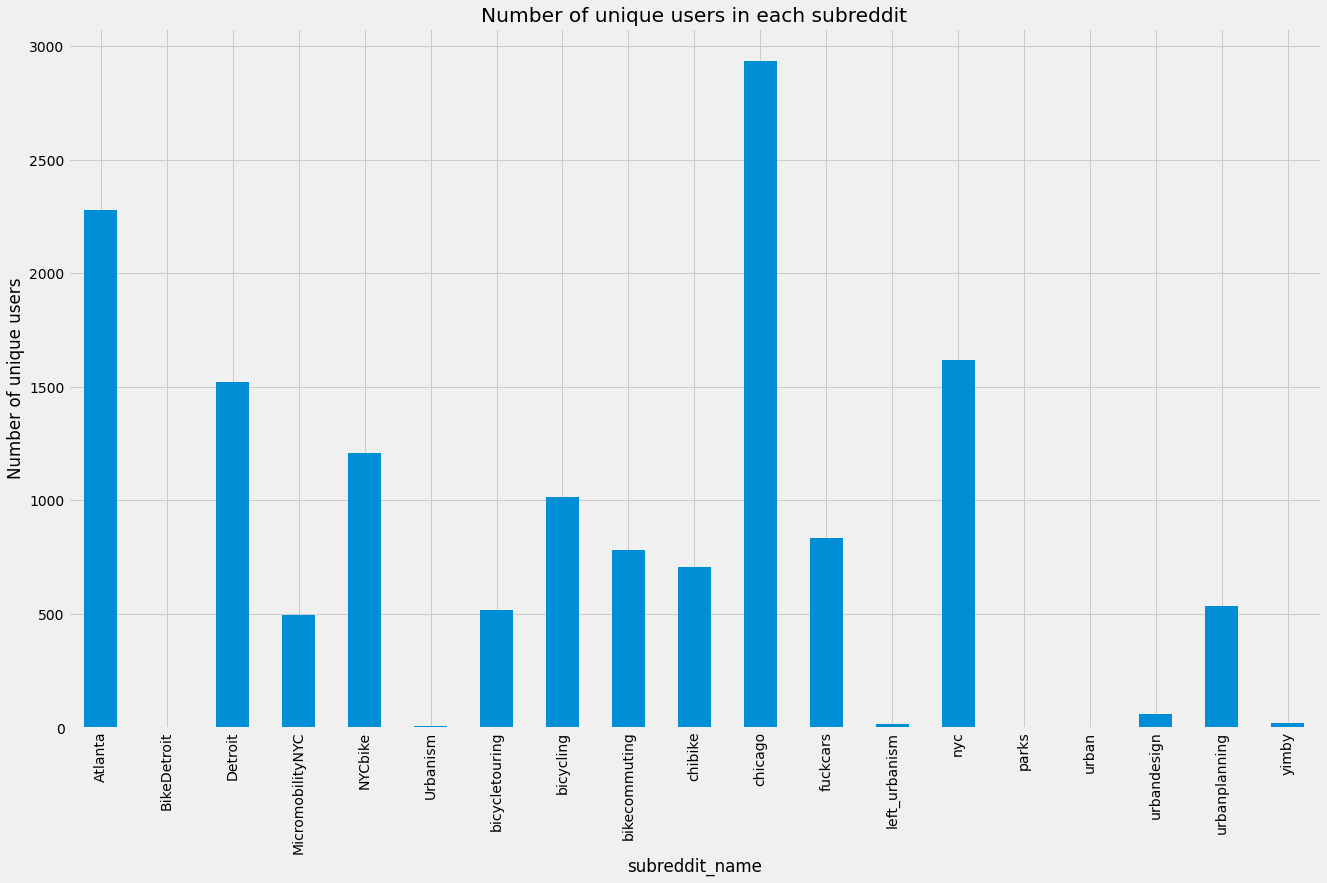
A quick overview reveals that most of the conversations around the rail-to-trails happen in city specific subreddits. Suprisingly, in more generic urban related subbreddits, there is very limited discussion on either the 4 rails to trails or greenways.
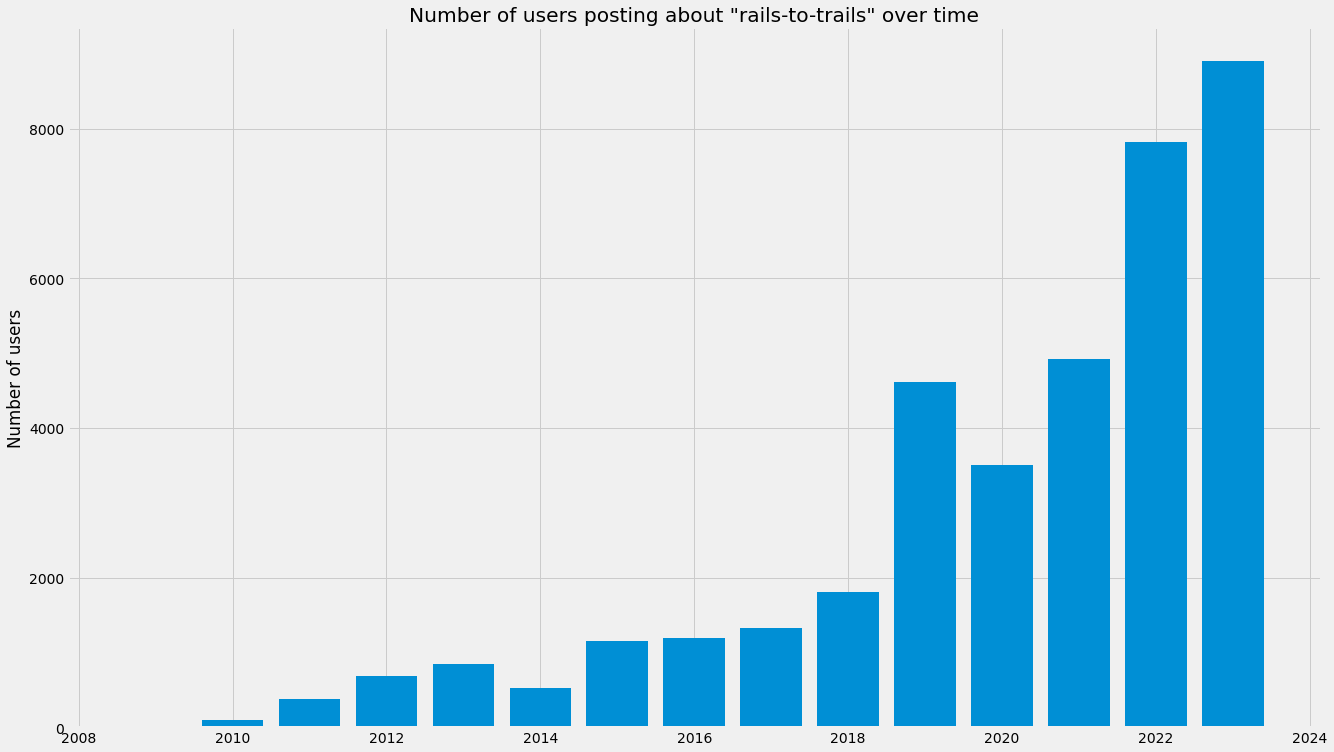
One more interesting observation is that the number of users discussing railts-to-trails are consistently increasing overtime. This includes users who have either created a post or commented on a post about rails-to-trails.
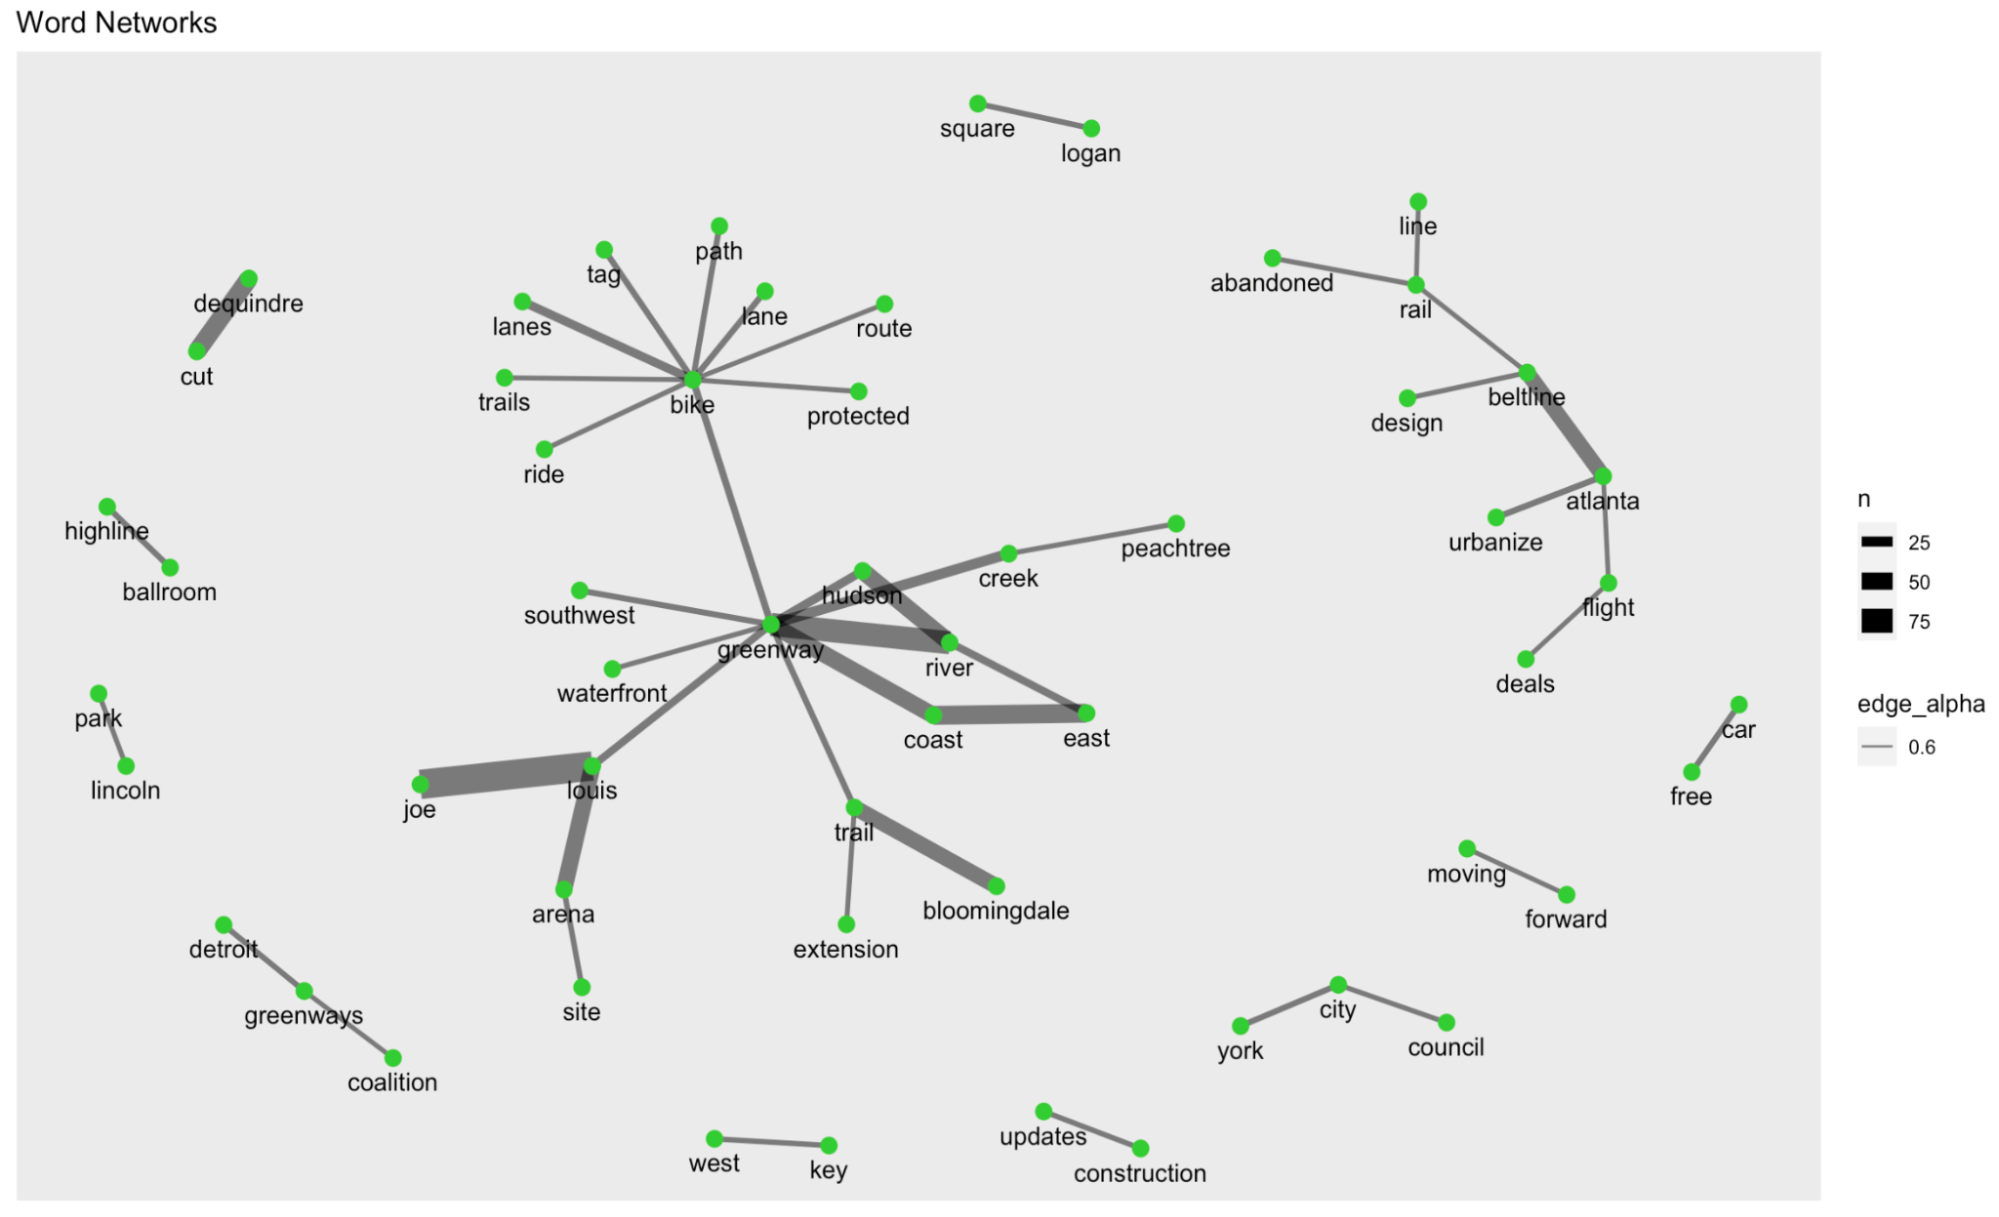
Finally, we also analyze word networks find common co-occuring patterns in the discussion. The word networks reveal a few interesting patterns. First, the word networks reveal that the discussion around rails-to-trails is fragmented by specific rails-to-trails. For example, the word network for the Atlanta subreddit reveals that the discussion is fragmented by the Beltline. Secondly, we see that biking is a common theme across all the cities.
What are the user characteristics?
Using BERT and VADER, two Natural Language Processing models used for sentiment analysis, we conducted sentiment analysis on our dataset. BERT is a binary classifier that classifies text into positive and negative sentiment. VADER is a rule based model that classifies text into positive, negative and neutral sentiment giving sentiment scores. VADER is also specifically suited for social media text.
Once we calculated the sentiment scores for both models, we then calculated the average sentiment by user to find distribution of the sentiment by user to get a sense of people discussing rails to trails.
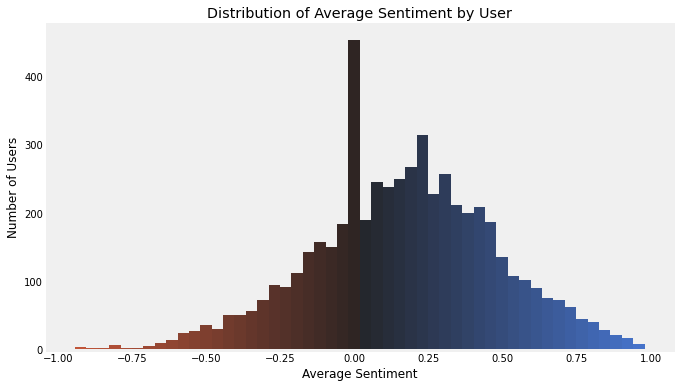
The distribution reveals that the average sentiment of the users skew slighlty positive, but a vast number of users have "neutral" sentiment. It is also worth nothing that there more extreme positives than extreme negatives.
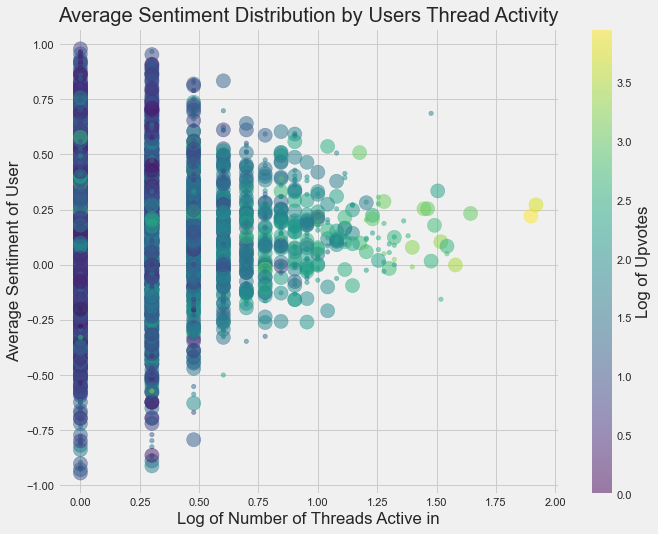
The initial findings of this study suggested that the majority of users engaging in discourse around urban greenways only post once. The average sentiment score of these single time users is neutral, demonstrating the idea that the sentiment spans from positive to negative but clusters in the center.
We also find that the more number of threads the user is active in, either through comments or new posts, the more neutral they get. This is an interesting finding as it suggests that the more active users are more nuanced in their views. This could be mean that in order to temper extreme viewpoints about urban issues, it might be helpful to create spaces for more discourse.
Also, looking at the number of upvotes, it also illustrates that users who post more neutral views get the most "upvotes" instead of of more extreme views.
Visualizing the semantic structure of the discourse
To better get an understanding of how sentiment of a post might relate to the structure of threads, the distribution of sentiment within the structure we visualized a semnatic network of the threads.
For the purposes of legibility, we visualized only one specific year "2014".
This network diagram dives into the structure of threads based on sentiment [ blue=positive,red=negative ], upvotes [size], and number of comments [nodes extending from center hub]. This particular network maps the 2014 sample of our dataset. In this network, the two largest center hubs are blue, again reinforcing the idea that threads with the most activity skew positive. The overall color of the network map leans neutral white to blue, again showing the volume of threads are neutral to positive. Still, there are standout threads with a more negative sentiment score and more upvotes.
How has the online sentiment around rails-to-trails evolved over time?
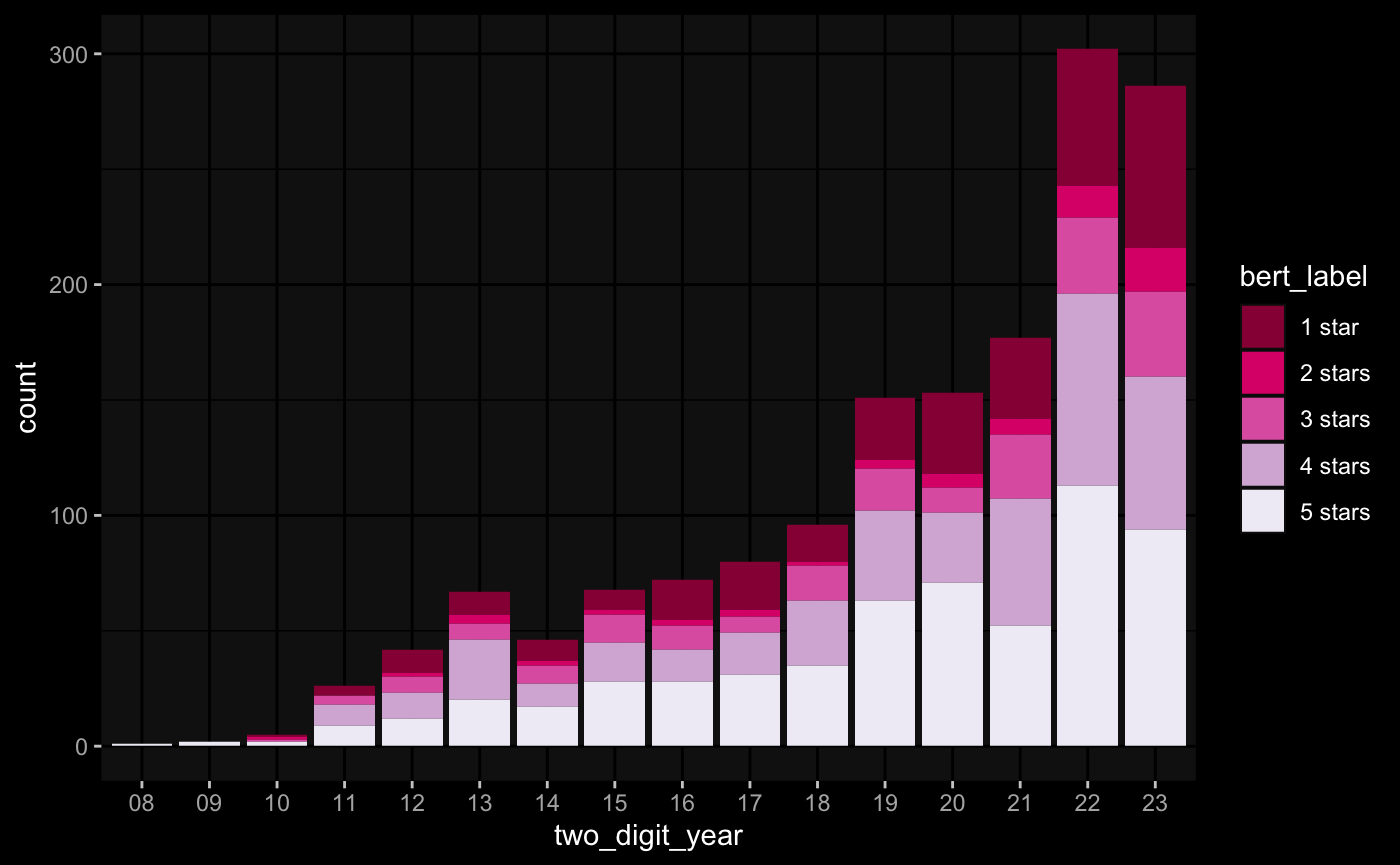
In this part, BERT(Bidirectional Encoder Representations from Transformers) Model are used to explore the sentiment of the Reddit thread data. This fine-tuned BERT model gives 1-5 star rating labels to our data based on the sentiments of the text, of which 1 star means extreme negative while 5 star means extreme positive.
The bar plot below displays the distribution of sentiment ratings from 2008 to 2023.We see an obviously growing number of comments by year with the presence of all sentiment ratings throughout the years, indicating a steady usage of the full range of sentiment. While extremely negative threads have increased in recent years, the scatter of points across each sentiment rating level is quite dense, reflecting the high volume of data and the widespread use of each sentiment category.
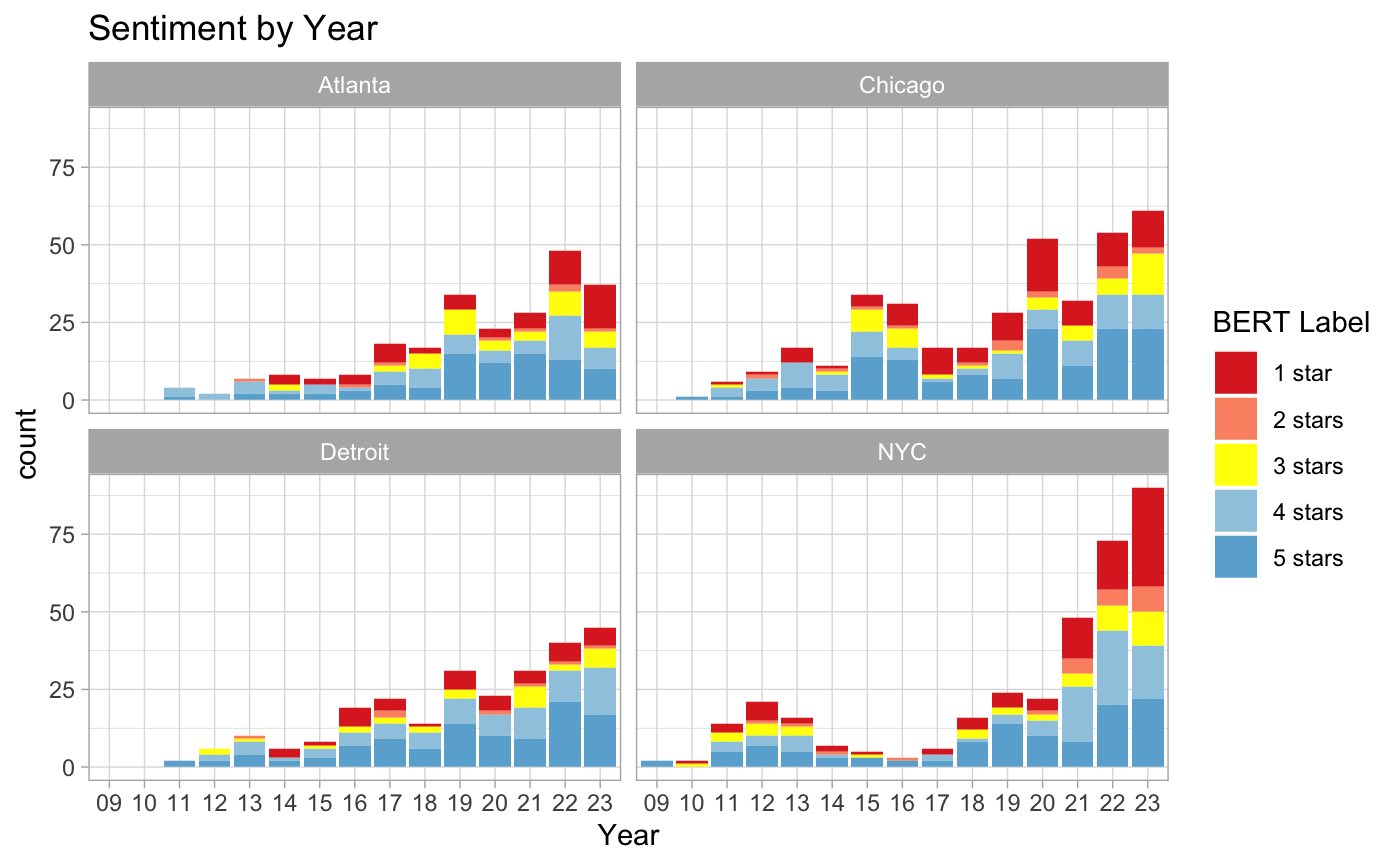
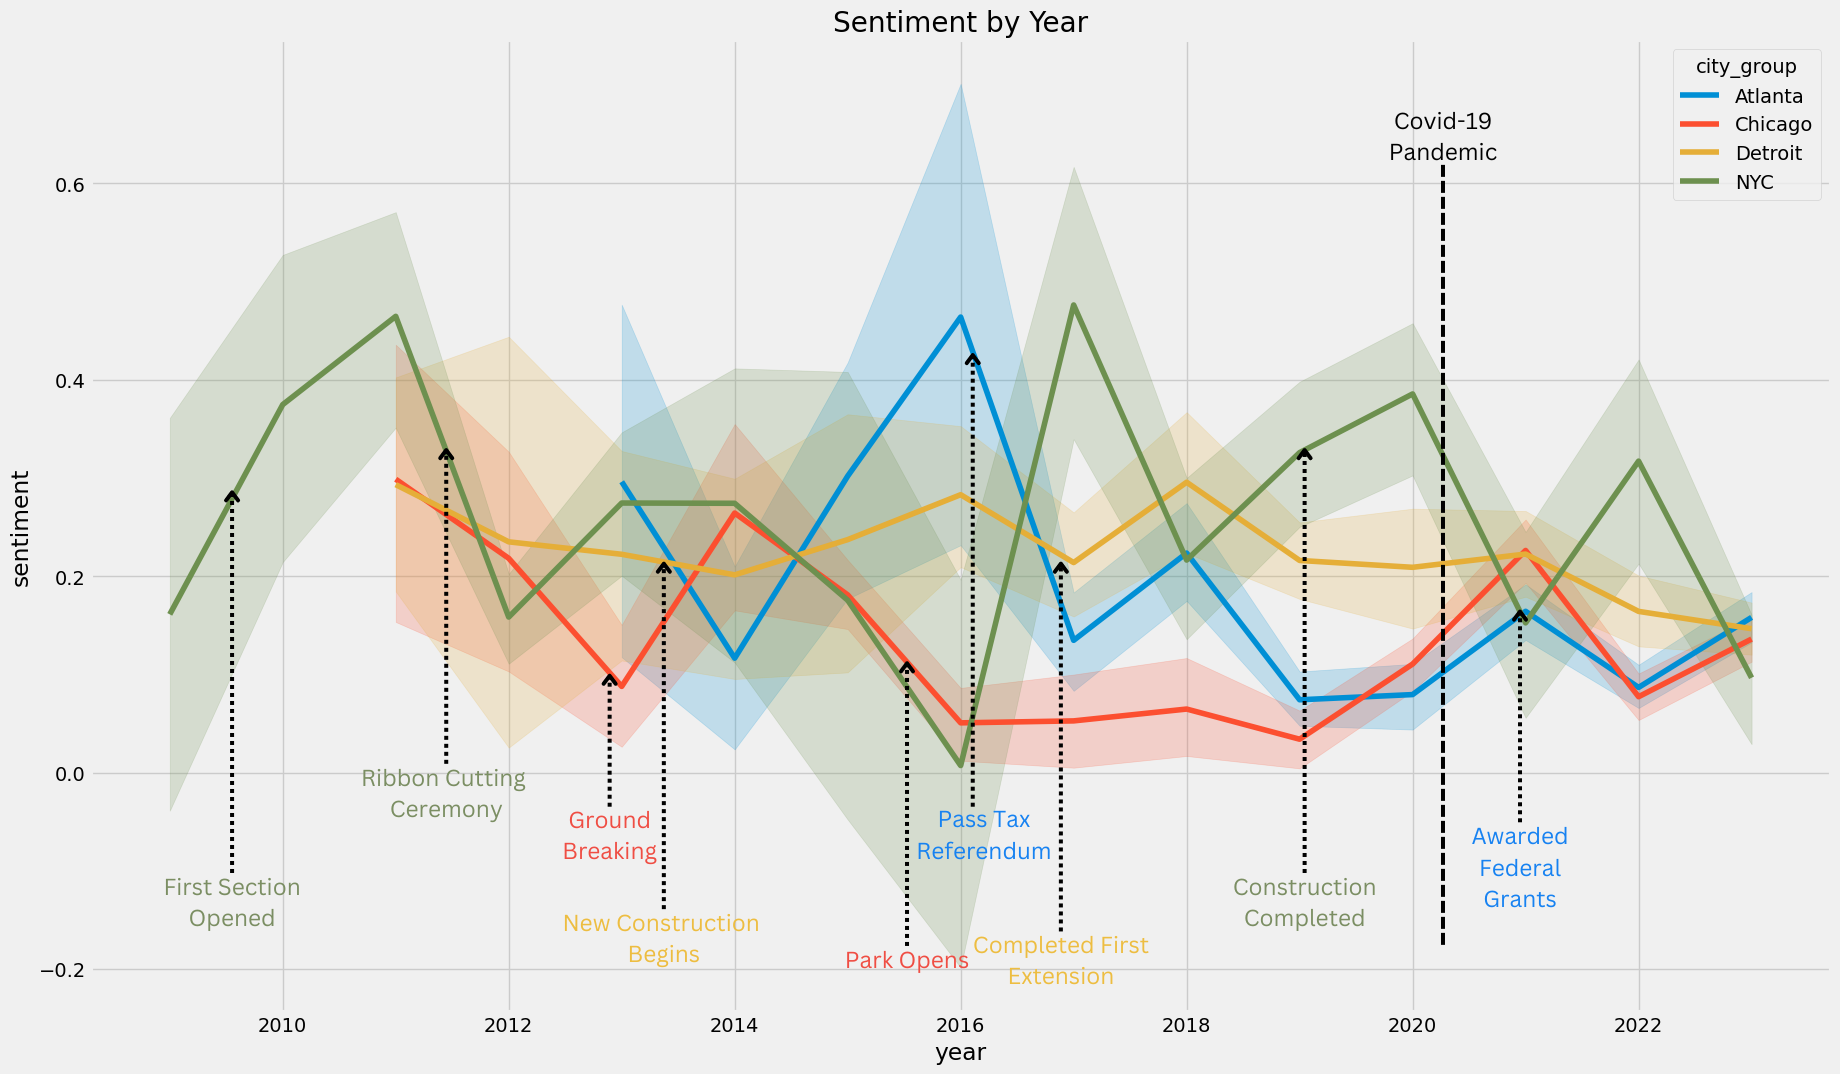
Then we divided into the four cities, Atlanta, NYC, Detroit, and Chicago, to explore the sentiment trends from 2009 to 2023 across. In Atlanta, there's been a noticeable growth in sentiment expression, especially in positive sentiments (4 and 5 stars) in recent years.NYC's sentiment distribution appears more varied, with an increase in both 1-star and 5-star ratings, suggesting a polarization in user sentiment. Detroit's chart reveals a modest rise in sentiment expression over time, with a recent uptick in 1-star ratings, possibly reflecting an increase in negative sentiment or specific local issues.Chicago shows a similar pattern to Atlanta, with a significant increase in positive sentiment expression, particularly in 5-star ratings.Across all cities, there's a trend toward more extreme sentiments (1 star and 5 stars) being expressed, while moderate sentiments (2 and 3 stars) remain less common.The data could indicate an overall increase in engagement on the platform and may reflect broader societal trends or local events influencing public sentiment.
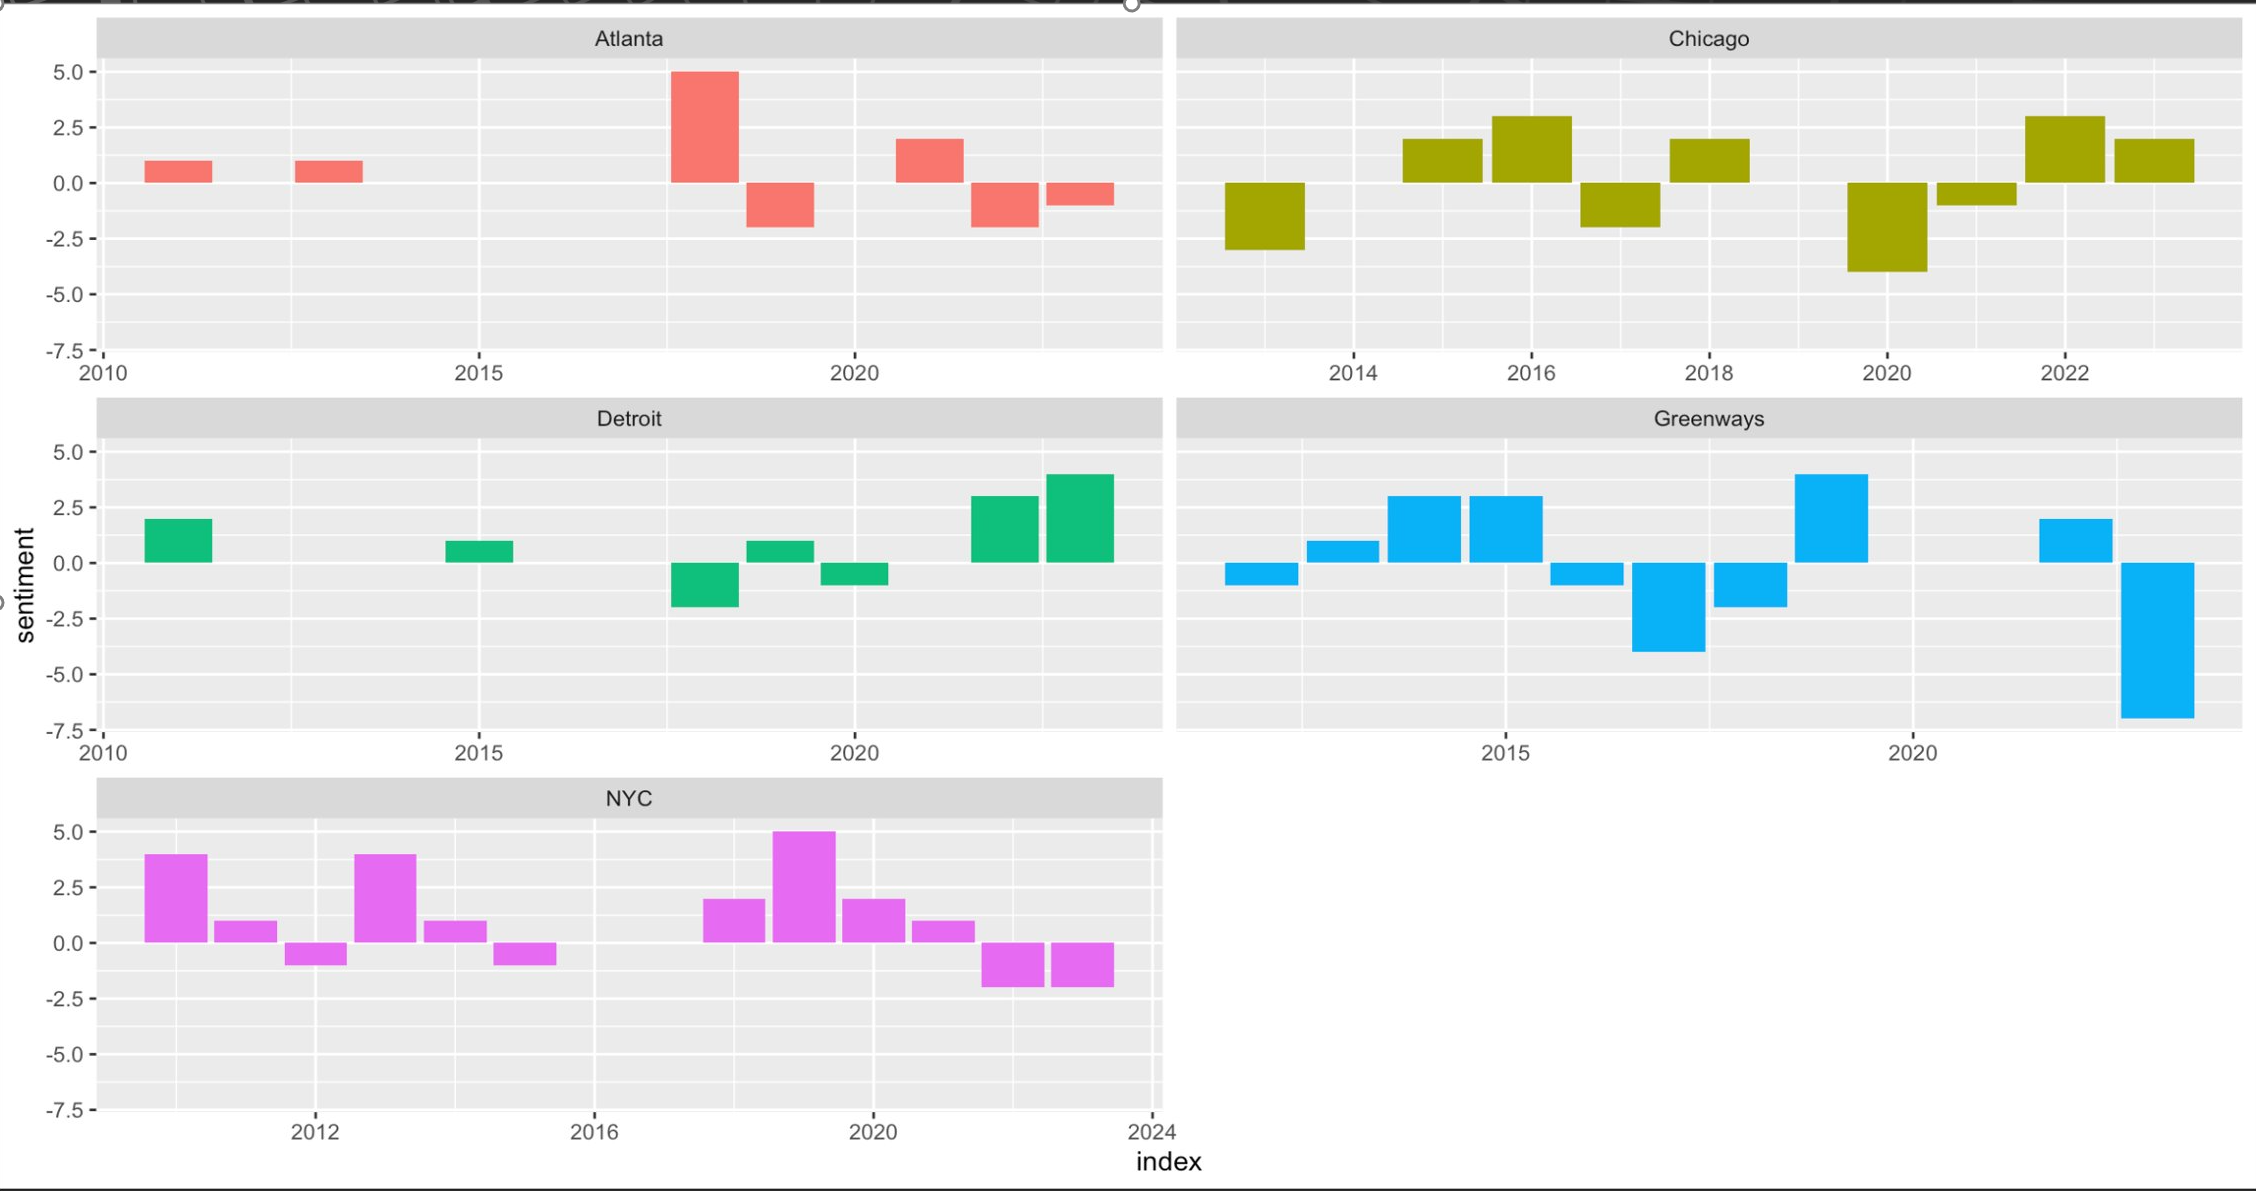
In order to further explore whether the variation in sentiment relates to external events, we tried to identify some urban planning related events that took place in these four major cities from 2009 to 2023, labeled on the graph below. In addition, we marked the dividing line before and after COVID-19 Pandemic. Some coupling of these events and sentiment peaks was found, demonstrating that sentiment changes may be influenced by external public affairs events. The result was more evident in the curves for Atlanta, which will be a primary object of topic modeling
What are the topics of concerns and themes that are prevelant in "rails-to-trails" discussion online?
We wanted to get an insight into the contents of the discussions to get a sense of what were the common themes and concerns within our dataset. To analyze the text we did three different forms of analysis. We started by constructed word maps to “look inside”, creating a Co-occurrence heatmap, then conducted topic modeling to find the themes within the dataset.
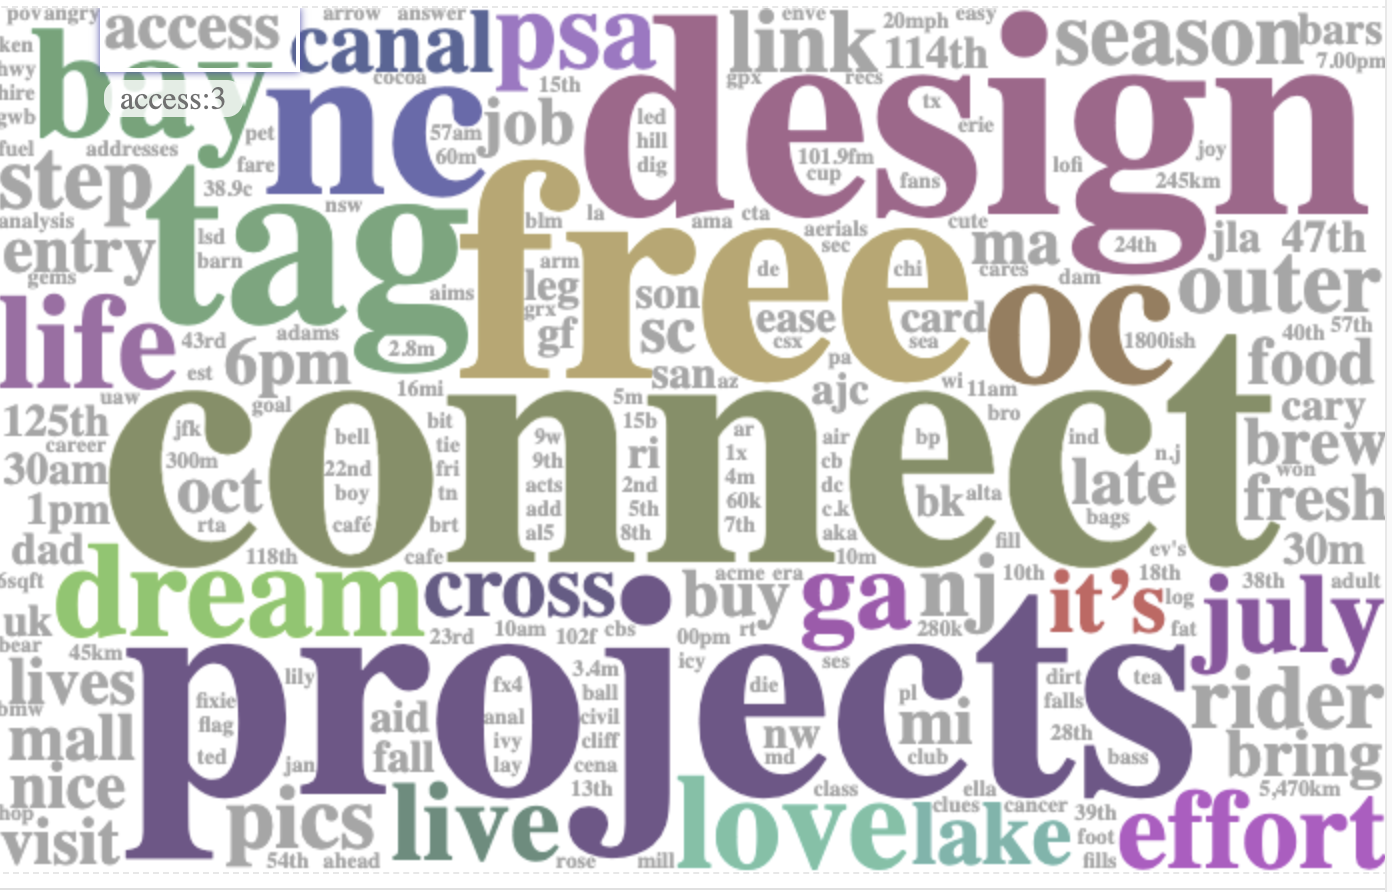
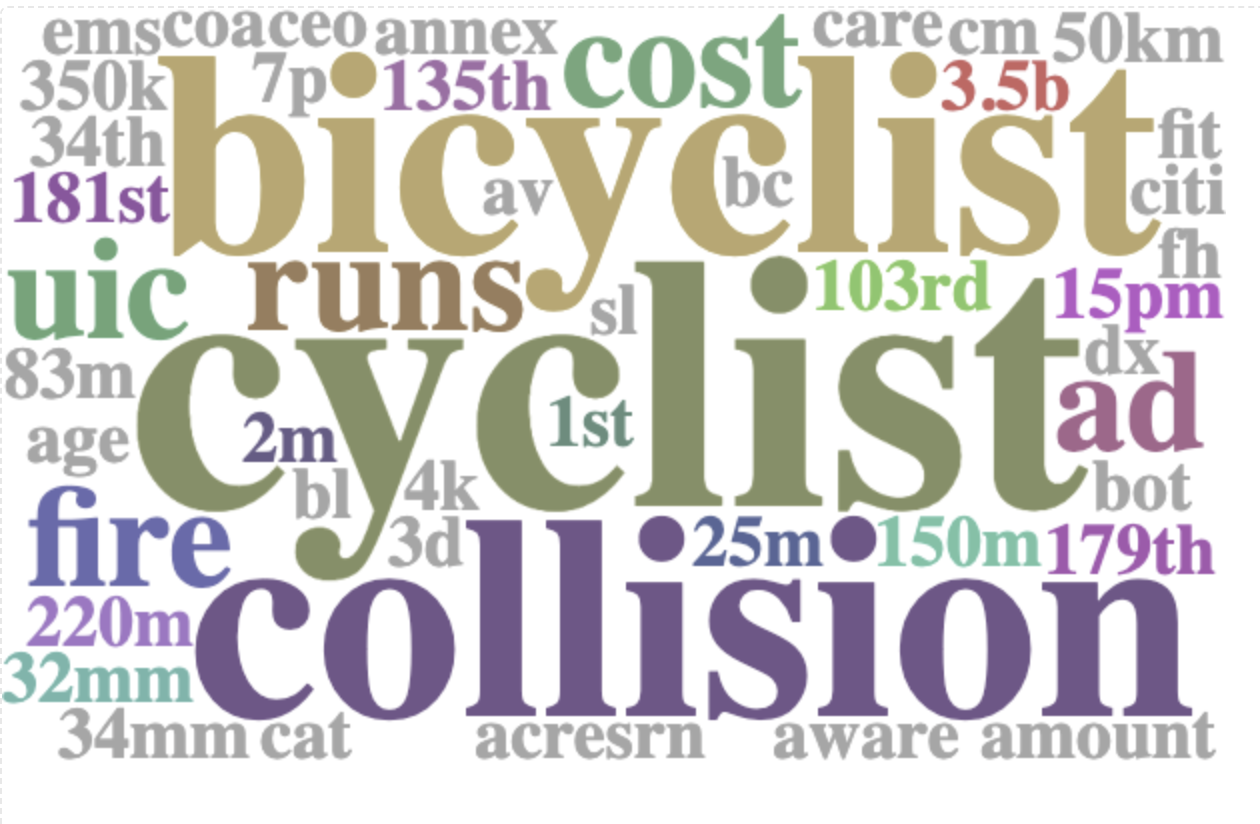
We've categorized the sentiments into negative (1 and 2 stars) and positive (4 and 5 stars) for clearer analysis.For each sentiment group, we created word clouds.In the positive word cloud, we see recurring terms like 'free,' 'design,' and 'connect,' which reflect the aspects users are happy about.The negative word cloud shows terms like 'cyclist' and 'collision' more often, which may point to the specific issues or negative experiences discussed.
|
|
|
|
Words Appearing in Positive Threads
|
Words Appearing in Negative Threads
|
Co-occurence Heatmap
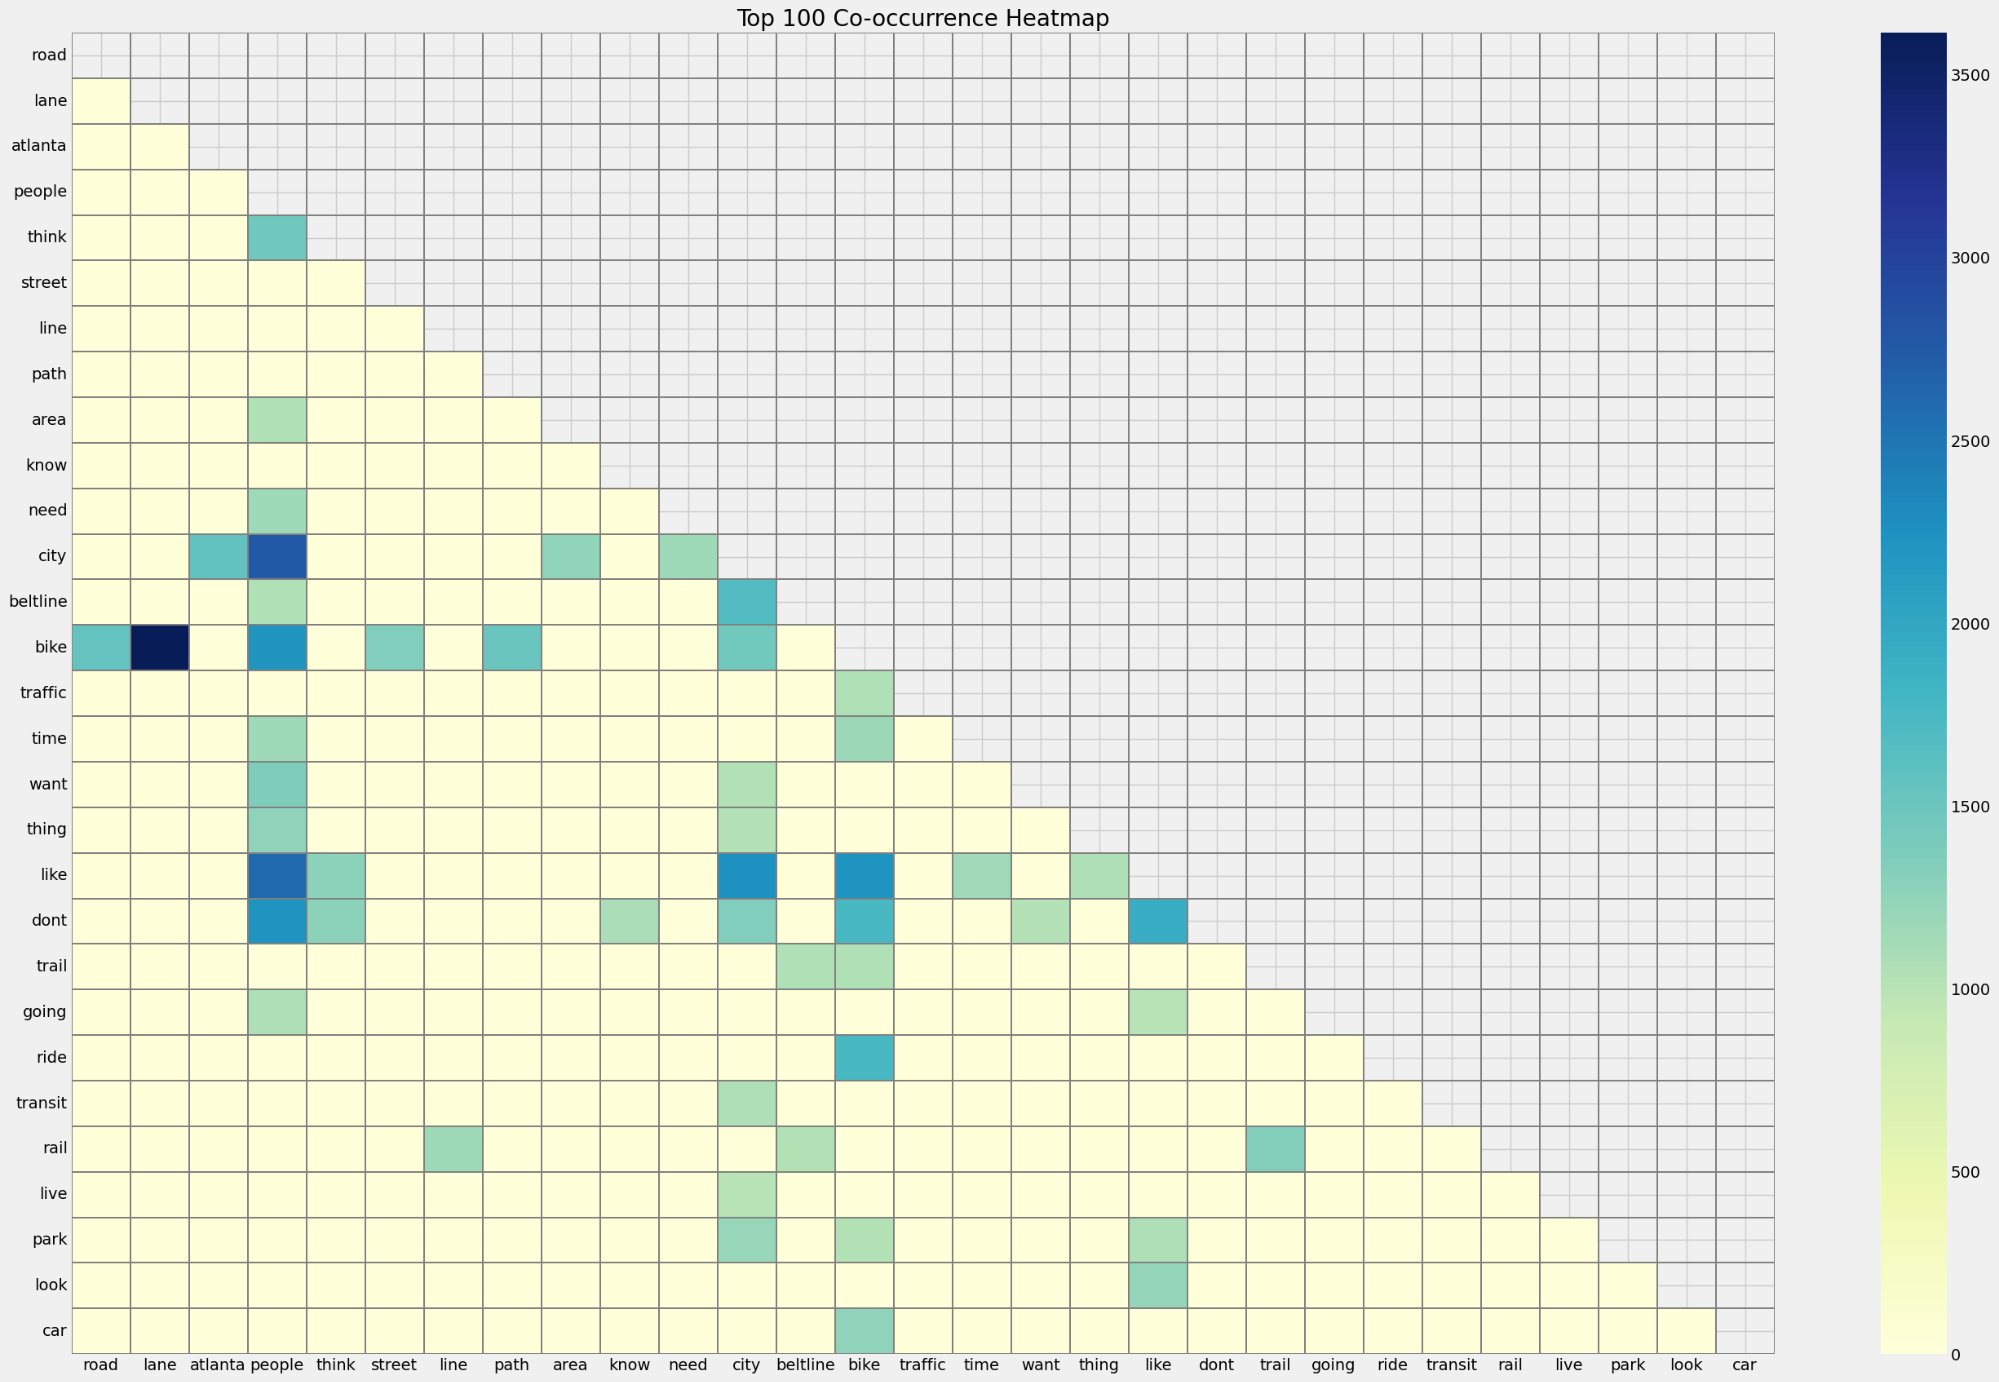
Looking at a plot of co-occuring words indicated there were a few topics that dominated the discourse, but there were no meaningful conclusions or insights we could draw from just the heatmap due to the diversity and size of our data set.
Topic Modeling
Methodology
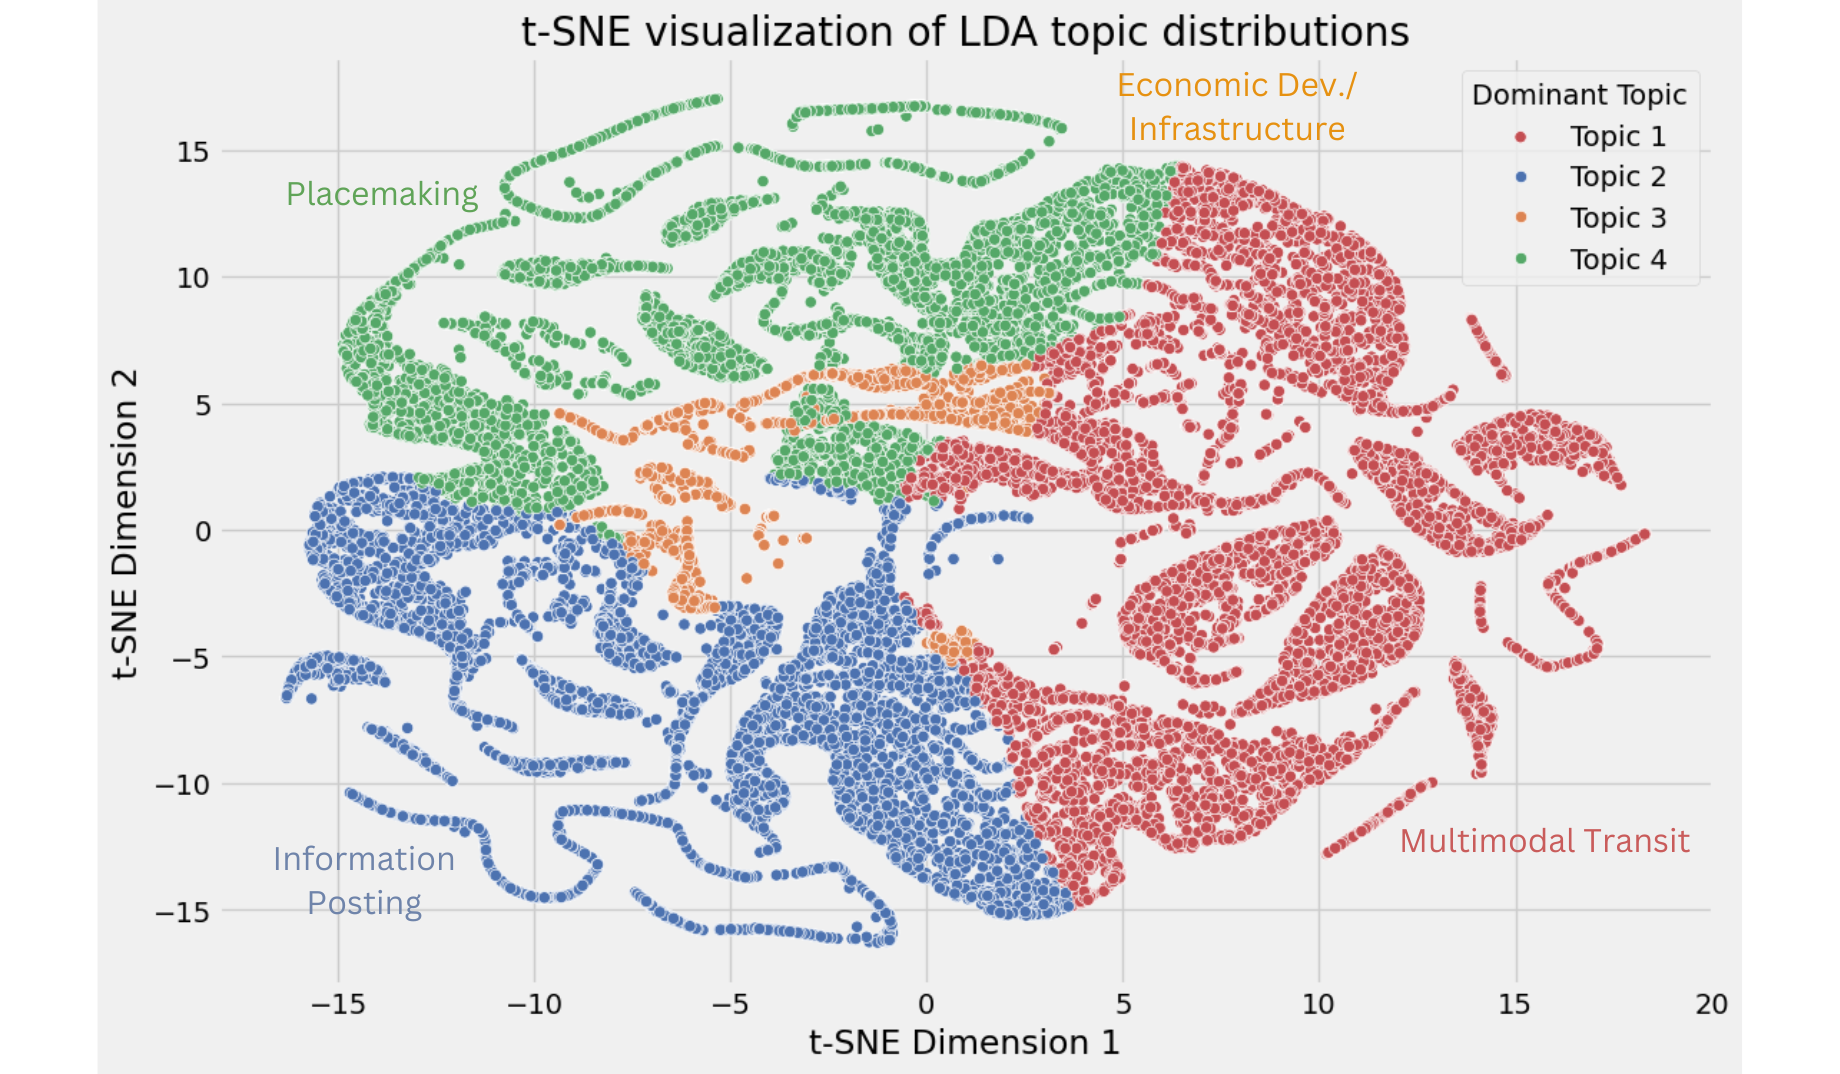
This study used topic modeling methods to extract the major themes and concerns in online discussions about urban greenways. Latent Dirichlet allocation (LDA) is a generative statistical model used in natural language processing to explain a set of observations through unobserved groups. LDA requires number of topics to be predefined. To find the optimal number of topics within our corpus, we started with n=2 (where n is number of topics) and went up till n=20. Through a mix of manually inspecting topics for each n and using topic cohesion measures, we settled on n=4
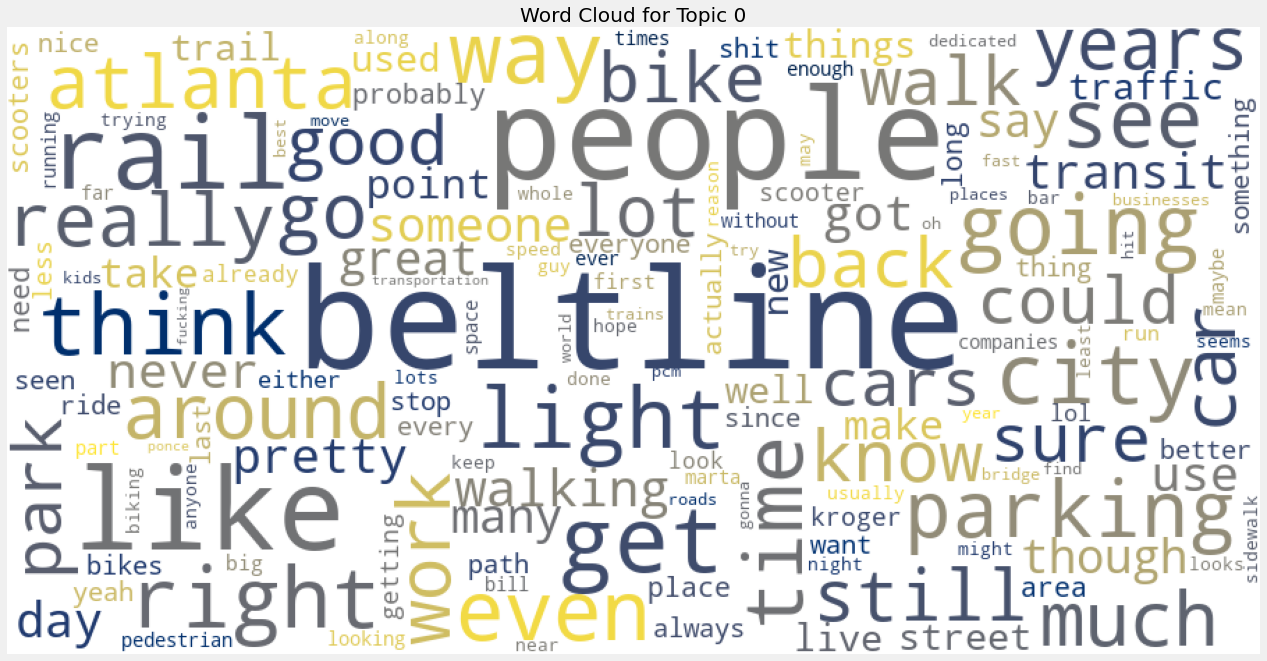
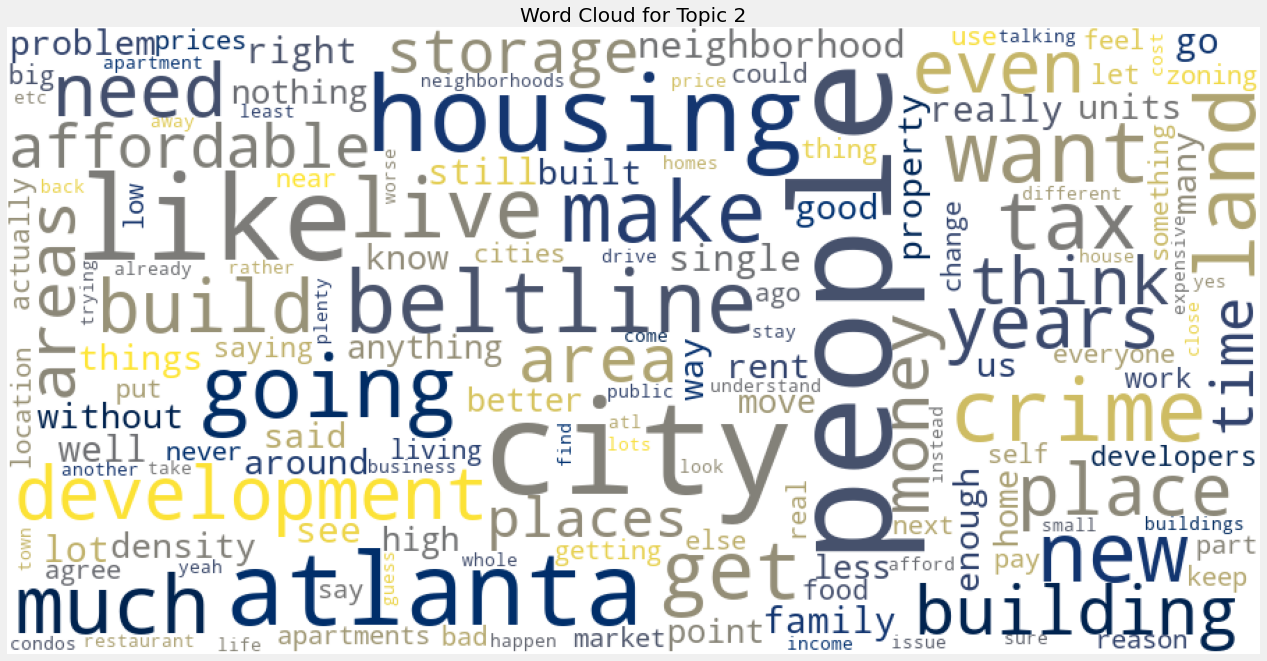
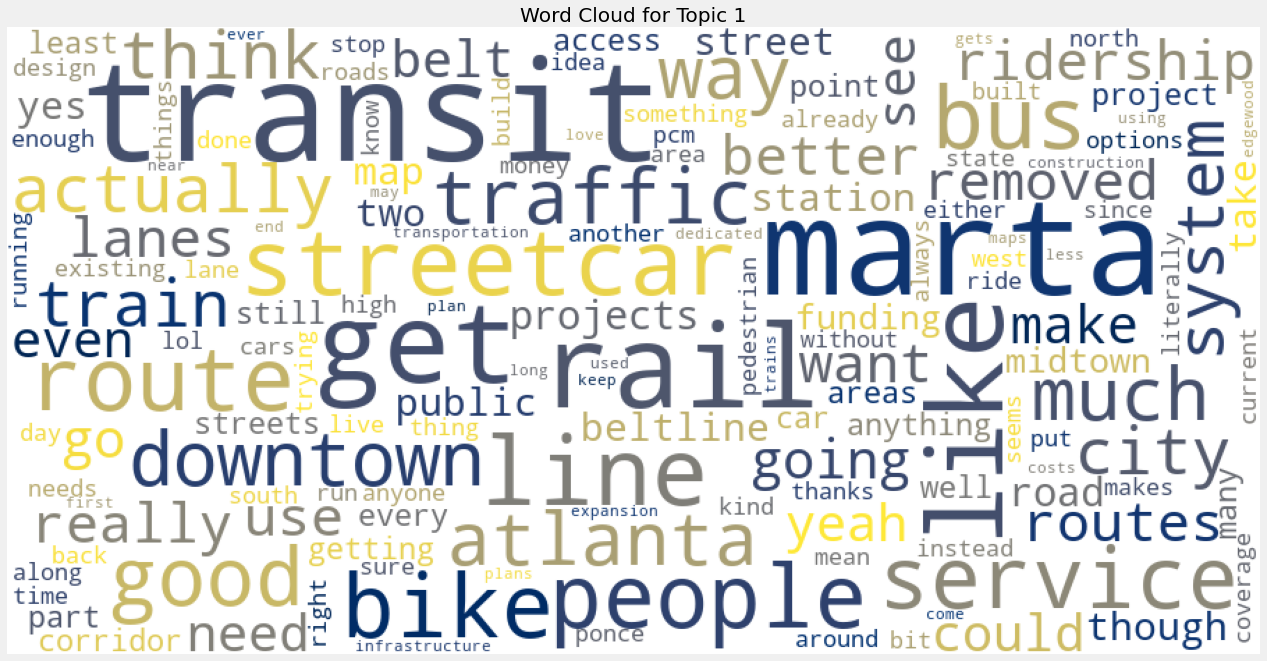
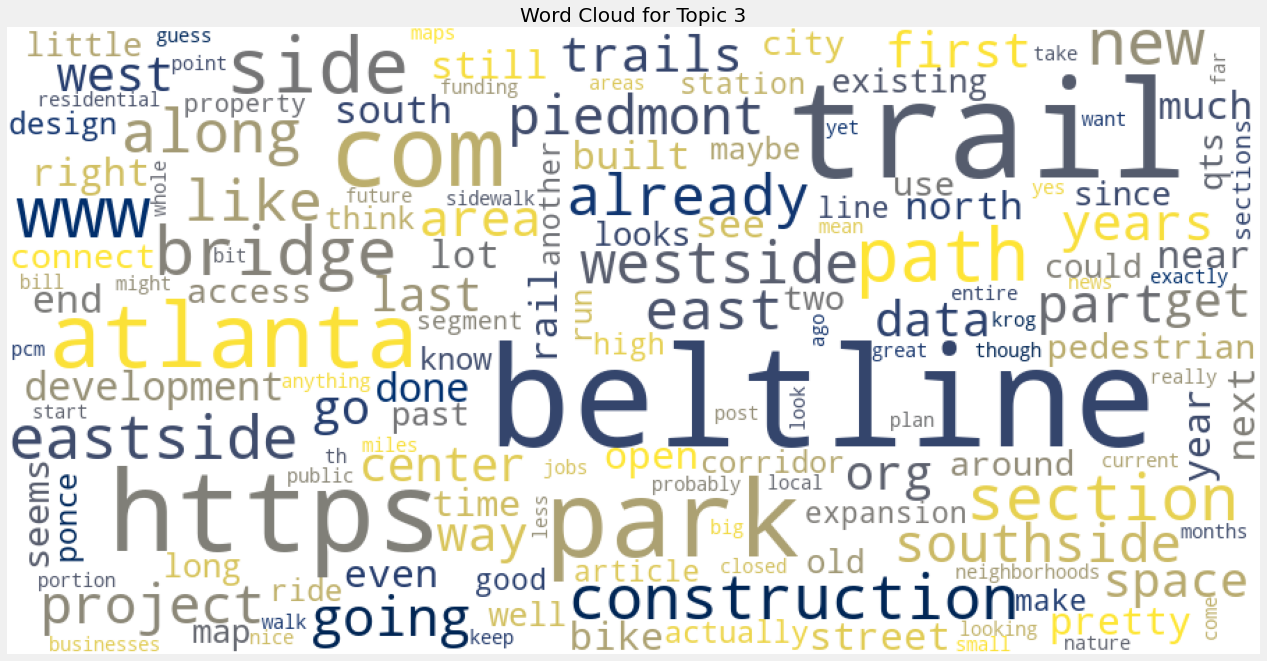
The 4 topics that dominated the discourse were able to be related back to some of the initial public assets and concerns identified in the literature review. The descriptive name assigned to the four topics are:
- placemaking
- multimodal transit
- economic development
- information posting
The names are based on manually inspecting the contents of each topic from the LDA distributions.
The following wordmaps illustrates the contents of each topic for a subset of meta dataset for the city of Atlanta.
Findings
After arriving at the number of topics, we want to find the proportion of topics within the entire corpuse. We then used HDP to visualize the distribution of topics within the corpus.
Once we had our number of topics, we also wanted to track the proportion of these topics in our corpus over the years. For that purpose we used Dynamic Topic Modeling (DTM) to track the four topics.
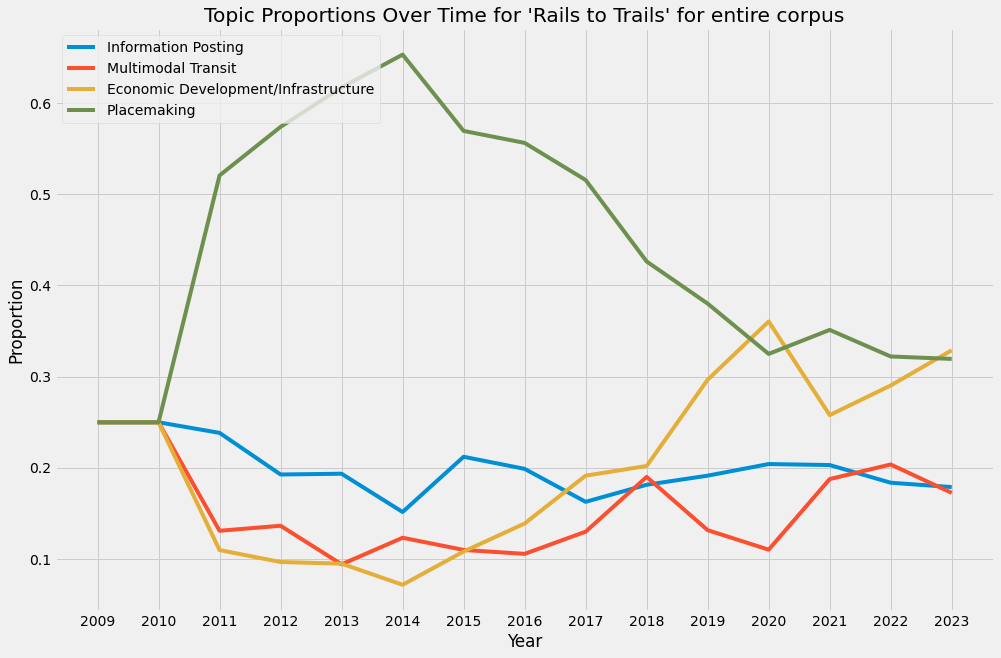
Looking at the change in topic prevalence since 2008, we noticed that “placemaking” takes a dip right in the year 2020, while conversation around infrastructure and economic developments starts to take over the discourse. The year 2020 is also the beginning of the pandemic. We wanted to explore whether this trend holds for the four cities as well.
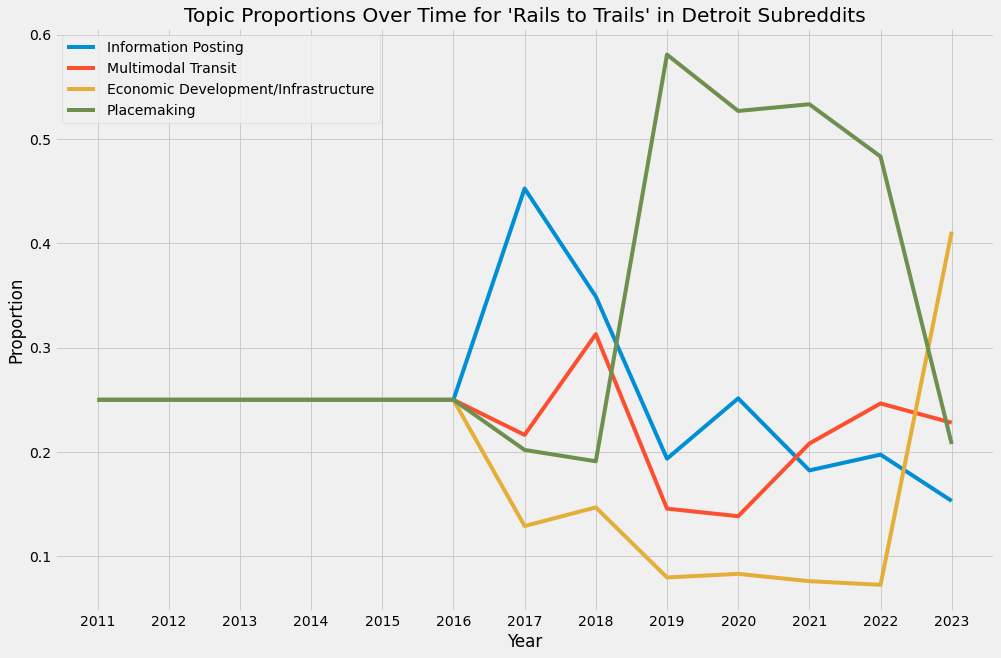
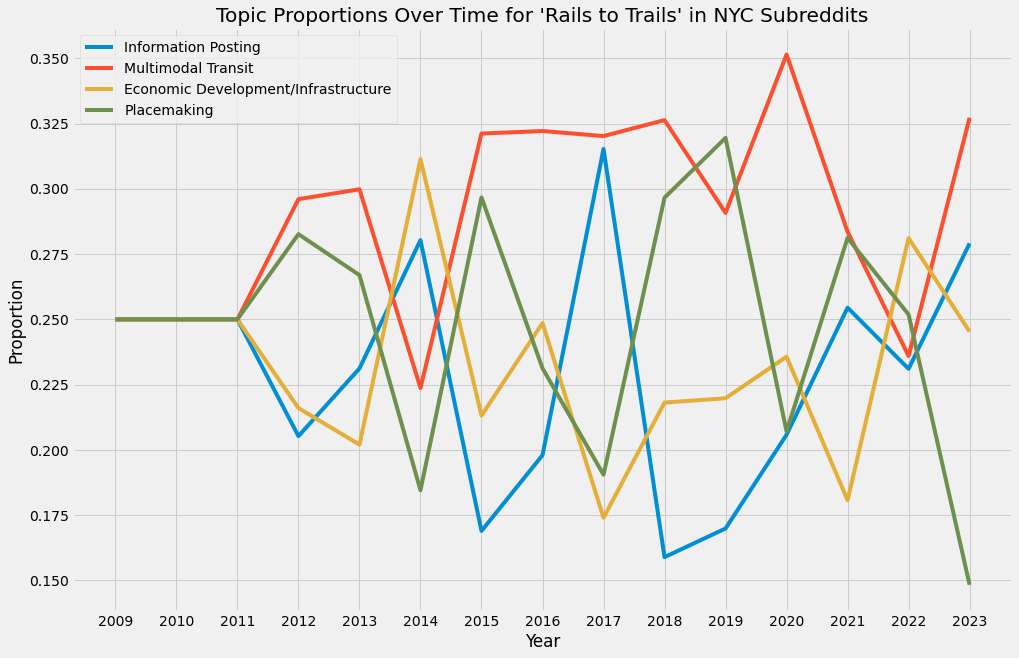
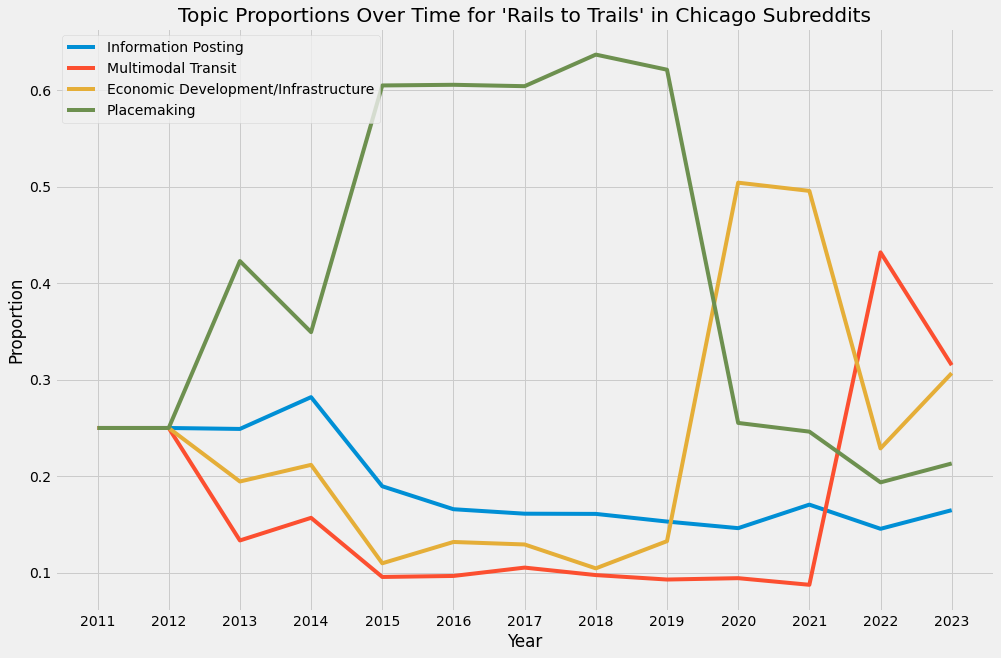
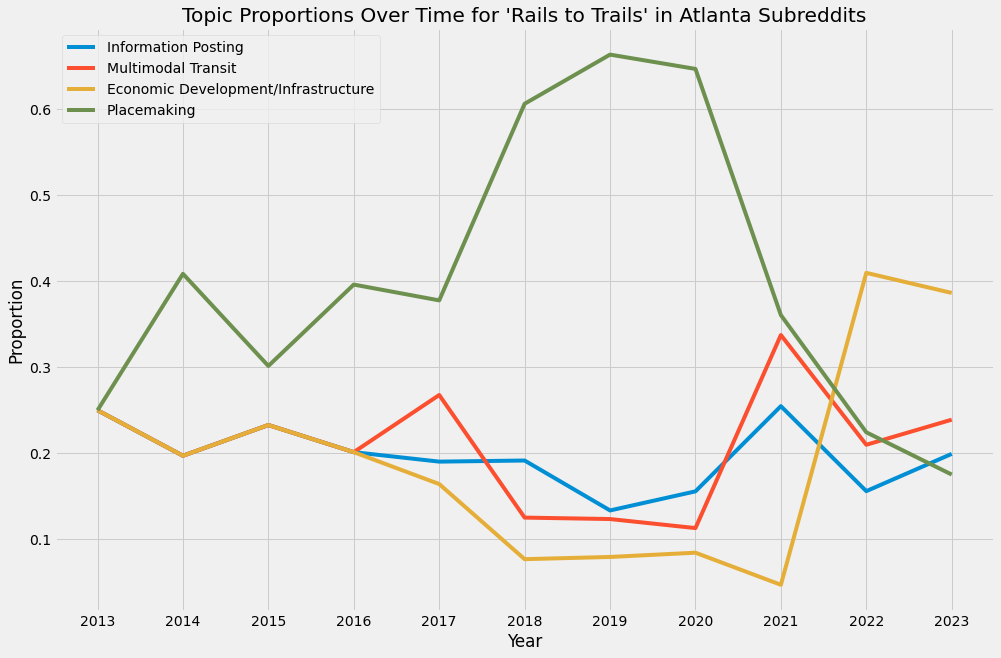
Looking at the change in topic prevalence over time in each of the four study cities, a similar pattern emerges. The placemaking topic dominates the conversation until 2020 when economic development and multimodal transit begin to take over the conversation. The repeated occurrence of social impact based topics beginning to share a larger proportion of the online discourse around 2020 suggests there is a connection with the Covid-19 pandemic. This idea emerges that large scale civic disruptions can influence the online discourse of major urban infrastructure.
Summary
The overall findings in this study can be summarized by the following list:
- Volume: The online conversations around greenways have increased since 2008.
- Pattern: The majority of users post only once, and post with an extreme position.
- Position: Users that are very active skew towards a more neutral and nuanced position.
- Skew: The volume of user activity skews positive.
- Topics: Discussions around greenways can be clustered into 4 general topics: multimodal transit, information posting, economic development, and placemaking.
- Covid impacted the discourse, economic and safety concerns, less general placemaking.
- Timing: Covid impacted the discourse, economic and safety concerns, less general placemaking.
- Conversation: General discourse on greenways was popular at the beginning of our study, over time, specifically after covid, discourse on economic development and multimodal transit took over the conversation.
To answer the three research concerns we started with, our results tell us:
- The users tend to be slighlty more positive in their discussion about rails to trails online. Most users are occasional posters but and they are ones that tend to have the most extreme opninions. The more active users are more neutral in their sentiment and also receive most engagement. This trends holds for all cities in the study and is agnostic of subreddit.
- The absolute number of users posting online has increased and the sentiment tends to trend slighlty positive. The sentiment online seems to be impacted by real world events such as new developments, major milestones for a project or important events, but the effect needs to studied. What is clear is that online communities are a vibrant place that have diverse discourse.
- Using machine learning, we were able to identify four major themes in the discourse that were true for the entire corpus as well as the city specific data. These four topics were: placemaking, multimodal transit, economic development, information posting. While placemaking dominated the discourse historically, we have recently seen a surge in conversation around the multimodal transit, economic development and infrastructure. In all cities a major surge occured in year 2020, which is the year of pandemic signifying that the pandemic caused a major shift in the publics concerns about urban greenways and its impacts.
This report delved into an exploration of Reddit threads related to “Rails to Trail” on sentiment analysis, user activity analysis, and topic analysis. While it provides significant insight into the patterns of users’ conversation and sentiments on Rails to Trail, there are certain limitations and suggestions for future study, which help outline the next steps in understanding the dynamic and nature of social media discourse.
Limitations:
Firstly, the Reddit user base does not reflect the general population, which limits the generalizability of our findings. Secondly, the VADER model used in this study is specifically used for social media but trained on twitter interactions, which may affect its accuracy and applicability to Reddit. Finally,the research had a limited scope in aligning the changing sentiment on Reddit with real-world events. This limitation restricts our understanding of how online sentiment reflects or reacts to external events.
Future Study:
The future research will consider expanding the timeline to include a broader range of real-world events. This would allow for a more comprehensive understanding of how sentiments on social media evolve over time. Besides, the user engagement dynamics will be considered to investigate whether new users are entering the conversation. Also, the impact of large scale civic events on online conversation will be analysed.
References:
Atlanta beltline timeline. Atlanta Beltline. (n.d.).
The high line : NYC parks. (n.d.).
Institute for Housing Studies. (2020). (rep.). Displacement Pressure in Context: Examining Recent Housing Market Changes Near The 606. Chicago, IL.
Keith, S. J. (2021). Impacts of Urban Greenways on Nearby Residents: An Analysis of Environmental Justice on the Atlanta Beltline. ProQuest Dissertations Publishing.
Palardy, N. P., Boley, B. B., & Johnson Gaither, C. (2018). Residents and urban greenways: Modeling support for the Atlanta BeltLine. Landscape and Urban Planning, 169, 250–259. https://doi.org/10.1016/j.landurbplan.2017.09.006
Gao, Y., Chen, Y., Lan, M., Shize, G., Zhang, P., & Liu, Y. (2022). Measuring urban sentiments from social media data: A dual-polarity metric approach. Journal of Geographical Systems, 24(2), 199-221. doi:https://doi.org/10.1007/s10109-021-00369-z
Appendice:
The following is the code for data analysis: